Tracing with PHP and OpenTelemetry

Historically the web development solutions that Evoluted have produced are majestic monoliths, but increasingly we’re integrating with multifarious client systems as well as a growing number of internal APIs. We’re certainly nowhere near Monzo’s microservice bonanza, and calling any of our systems “meshes” would be entirely overblown, but for a small team it’s noticeably different to what we’re traditionally used to dealing with. This presents difficulties when trying to track down performance problems or errors that might happen several layers deep and not be immediately obvious.
We use Laravel as a foundation for many of our projects and packages like the debug bar and Clockwork are fantastic for profiling those monoliths in isolation, however they lack the ability to visualise performance and events across services. Distributed tracing attempts to solve this problem. Most developers will be familiar with a stack trace, usually in the context of an exception and tracking where it triggered in the code base. Distributed tracing expands this across services so that you can see exactly what is going on in your application as a whole. Logs may tell you what has happened, tracing (and metrics) tell you what is happening, like sitting on the flight deck and seeing current air pressure, ground speed, and altitude.
Tracing, distributed or otherwise, has been possible with PHP for a long time, but it was only with version 8.0 that it became feasible to instrument PHP in production rather than just when developing. This is primarily due to the efforts of DataDog and the PHP internals team to introduce a stable, performant API for PHP extensions to hook into. This opened the door for companies like DataDog, Sentry, NewRelic, Splunk, Dynatrace and other observability platforms to treat PHP as a first class citizen when it comes to tracing and metrics.
That list of companies does raise the potential for there to be many different formats and protocols for that distributed tracing, all with different features and quirks. Which is where OpenTelemetry comes in: an open, community constructed set of standards and integrations to handle traces, metrics and logs, or more simply “observability”. After spending the morning of one of our 10% days reading up on the concepts and ideas, I started wondering how Evoluted could integrate OpenTelemetry (Otel) into our projects. There is a guide both on the PHP SDK and for instrumenting Laravel, but as an utter newbie to both the terminology and technology, they left me with an incomplete view of how to set up a project. Hopefully this guide can answer some of the same questions I had.
There is a sample OpenTelemetry PHP project setup available to accompany this guide.
What we’re doing
At a minimum I wanted to be able to tell how long each sub-request to different systems took within an overall request - so a request to a frontend would contact several backends and I wanted to know not only the overall request time but how long each backend took as well. This is exactly what tracing is good for, and I knew generally that I had to pass relevant IDs “down the chain” when doing (for instance) HTTP and RPC requests.
The umbrella OpenTelemetry project has several subprojects that hook into things like Laravel and PSR-18 (HTTP client) requests that sounded like the place to start, but did introduce me to the first bit of unfamiliar terminology: instrumentation. Available in both “auto” and “manual” flavours, this is how traces are built - you need to hook into (add an “instrument” to) your code to find out how long things take and in what order. In Otel terminology these are “spans”.
So I needed to instrument my code - automatically or otherwise - to generate these spans.
Where to start
As the PHP SDK guide points out, the first thing you’re going to need is the Otel extension, installable via PECL or if you’re using Docker, the phenomenal PHP extension installer. There are some other recommended extensions but I’ll cover those later.
pecl install opentelemetryNext you’re going to need the Otel SDK, this is a Composer package and is the platform that all the instrumentation packages build upon.
composer require open-telemetry/sdkIf you’re anything like me you probably spotted the environment variable configuration, popped them into your .env file and then spent several hours trying to debug why things weren’t working. The Otel SDK and all instrumentation packages bootstrap themselves very early in a request lifecycle - during Composer’s autoload - so before even Laravel has a chance to parse your .env file. That means popping the values into that file won’t do what you expect. If you’re running Docker you can pass these environment variables via that, or failing that, pop a few putenv() calls into your public/index.php file before the Composer autoload. Your ideal solution will depend on how your application is run.
<?php

putenv('OTEL_PHP_AUTOLOAD_ENABLED=true');
putenv('OTEL_SERVICE_NAME=my-lovely-application');

require DIR.'/../vendor/autoload.php';
With just the SDK, you can now go and start putting manual instrumentation into your application. The Otel extension allows you to efficiently “hook” into when classes and interfaces are called. Which is exactly what the “auto” instrumentation packages do out of the box without any more code from you.
So the Laravel auto instrumentation will give you spans for things like database queries, queue workers and the cache without you having to do anything other than a composer require. Likewise if you’re doing sub-requests to internal APIs, the PSR-18 auto instrumentation will make sure that span IDs (the “distributed” part of tracing) are correctly propagated. If you’re using the ubiquitous Guzzle which supports PSR-18 out of the box, you may still need to tweak your code to use the correctly instrumented methods. For us this meant changing $client->request() which is Guzzle specific, to $client->sendRequest() which is the PSR-18 interface method.
And that’s it, you’re all set up.
Viewing your traces
While that gives you everything you need to start recording traces, I would imagine you’d like to also store and view them right? Otel provides a few ways of exporting your traces (and metrics and logs) but is otherwise hands off with the visualisation and persistence, that’s down to your chosen observability platform. That might be self-hosted like Grafana or Splunk or cloud-hosted like DataDog or NewRelic. While you’re getting a handle on how this works (and likely debugging issues), I can wholly recommend Jaeger; if you’re using Docker Compose like we are for projects it’s effectively zero-configuration during development.
First things first though, you’ll need an exporter which turns the abstract trace and span representations into a specified format. For this we’ll use OLTP which is the Otel protocol. You can use it without, but installing the protobuf PHP extension will make this a lot faster. Install the composer package “open-telemetry/exporter-otlp” and make sure to set the OTEL_TRACES_EXPORTER environment variable to oltp to enable this.
pecl install protobuf
composer require open-telemetry/exporter-otlp
Now that you’ve got an exporter, we need a way of transporting it to Jaeger. For this we’ll use gRPC which is what a lot of the documentation assumes you’ll be using. Like OLTP, you can use it without but installing the grpc PHP extension will make this a lot quicker. Install the composer package “open-telemetry/transport-grpc” and set the OTEL_EXPORTER_OTLP_PROTOCOL environment variable to grpc.
pecl install grpc
composer require open-telemetry/transport-grpc
The only thing remaining is to tell the Otel SDK where to send your traces. Depending on how you’ve set up Jaeger (or your observability platform of choice), this should just be a URL for the environment variable OTEL_EXPORTER_OTLP_ENDPOINT, e.g. http://jaeger:4317 if you’re using Docker Compose and have “jaeger” service. Your environment variables then will look something like:
putenv('OTEL_PHP_AUTOLOAD_ENABLED=true');
putenv('OTEL_SERVICE_NAME=my-lovely-application');
putenv('OTEL_TRACES_EXPORTER=otlp');
putenv('OTEL_EXPORTER_OTLP_PROTOCOL=grpc');
putenv('OTEL_EXPORTER_OTLP_ENDPOINT=http://jaeger:4317');
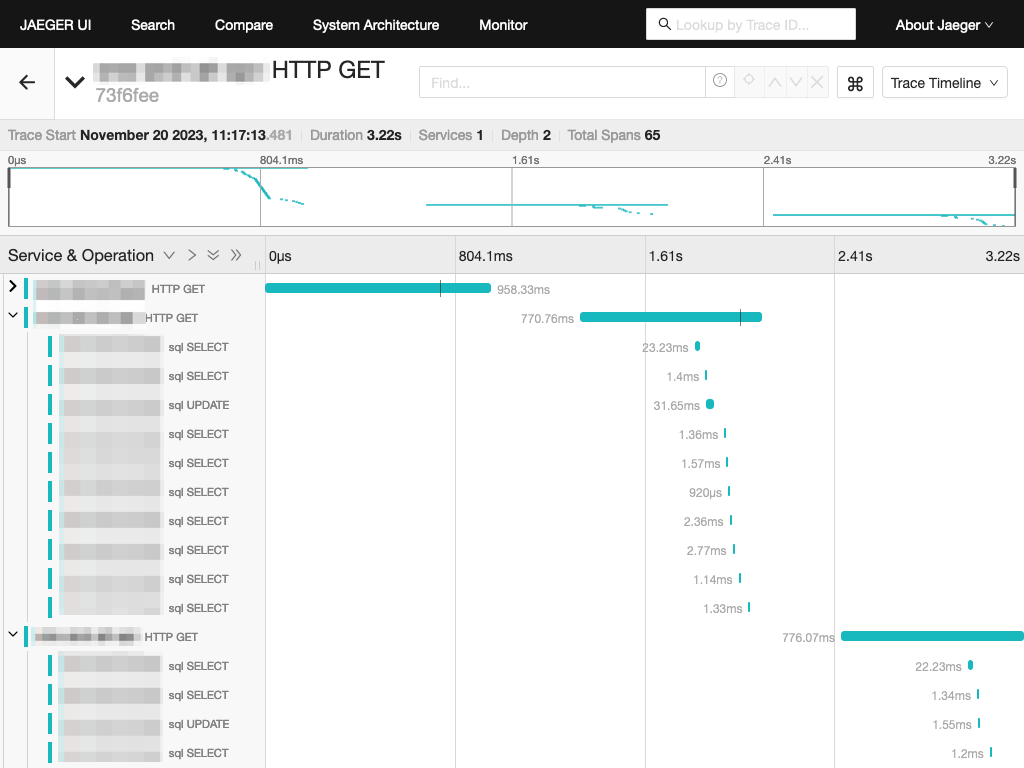
putenv('OTEL_PROPAGATORS=baggage,tracecontext');Now make a request in your application like normal, go into Jaeger and refresh the page, you should see your service in the dropdown. Select it, click “Find traces”, and you should see your shiny new trace in the interface.
Going further
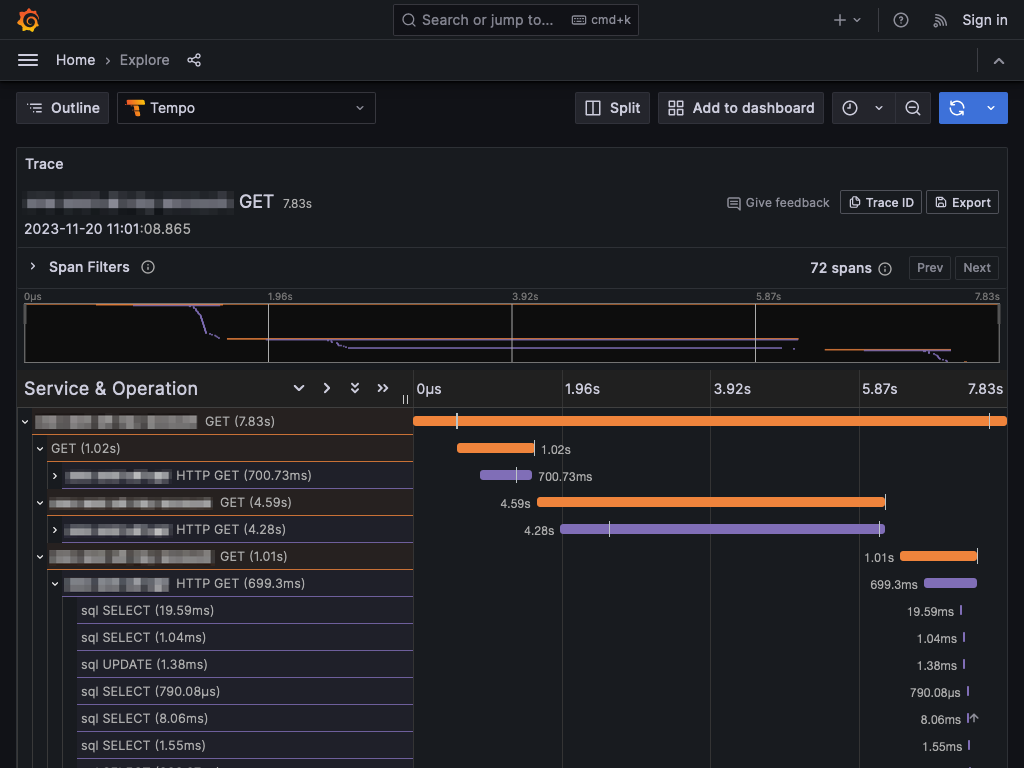
Even this basic setup gives you a lot of data to work with and for us highlighted a lot of areas that we could focus performance improvements on. The benefit of OpenTelemetry’s, well, openness is that it slotted neatly into our client’s systems as well. So even where a request left the boundary of our applications, we could see and work with their developers to improve responsiveness. It also meant that instead of rolling our own infrastructure we could hook into theirs, in this case Grafana which has first class support for OpenTelemetry via its Tempo agent.
With the “basics” in place it does enable us to start looking at some of the other features such as metrics for tracking things like order counts and memory usage to help better track performance and spot issues before they become serious.

In his role as Technical Team Lead, John’s expertise is vital to our development approach across several large-scale projects. He arrived at Evoluted in 2019, having worked in various roles for several local agencies, and now has almost two decades' experience in the industry. His primary skills are providing insight into architecture, scaling, dev-ops, deployment and security.